Commuting to work in three cities
Academic Task 1 · at least 150 words · about 20 minutes
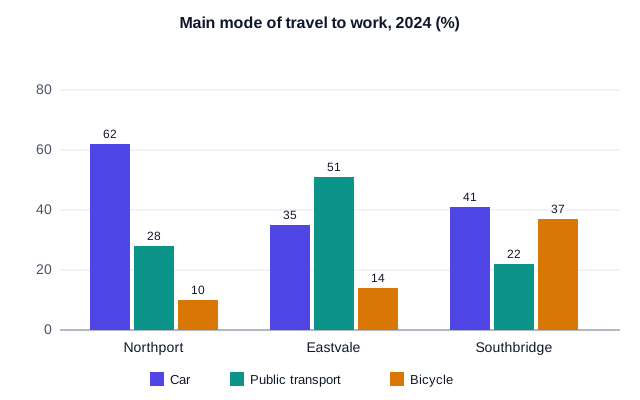
The bar chart shows the percentage of workers who travelled to work by car, public transport and bicycle in three cities in 2024. Summarise the information by selecting and reporting the main features, and make comparisons where relevant.
0 words
Spell-check is off, as in the real test. Your draft is saved on this device.